Database > RDS for MySQL > Server Dashboard
Server Dashboard
You can visualize performance metrics in chart form on the server dashboard. Charts are arranged according to a preset layout. Metrics s are collected once every minute and kept for up to five years. Metrics data is aggregated as average values over 5 minutes, 30 minutes, 2 hours, and a day. Retention period by aggregation unit is as follows.
| Aggregate Unit | Retention Period |
|---|---|
| 1 minute | 7 days |
| 5 minutes | 1 month |
| 30 minutes | 6 months |
| 2 hours | 2 years |
| 1 day | 5 years |
Layout
Use a layout to show the size and position of charts. When the service is enabled, 2 layouts are provided by default, Default system index and Default MySQL index. Default layouts cannot be changed or deleted and you cannot add charts or change or delete charts that have been added. If you want to view charts in addition to the default layouts, you can create a layout and add charts.
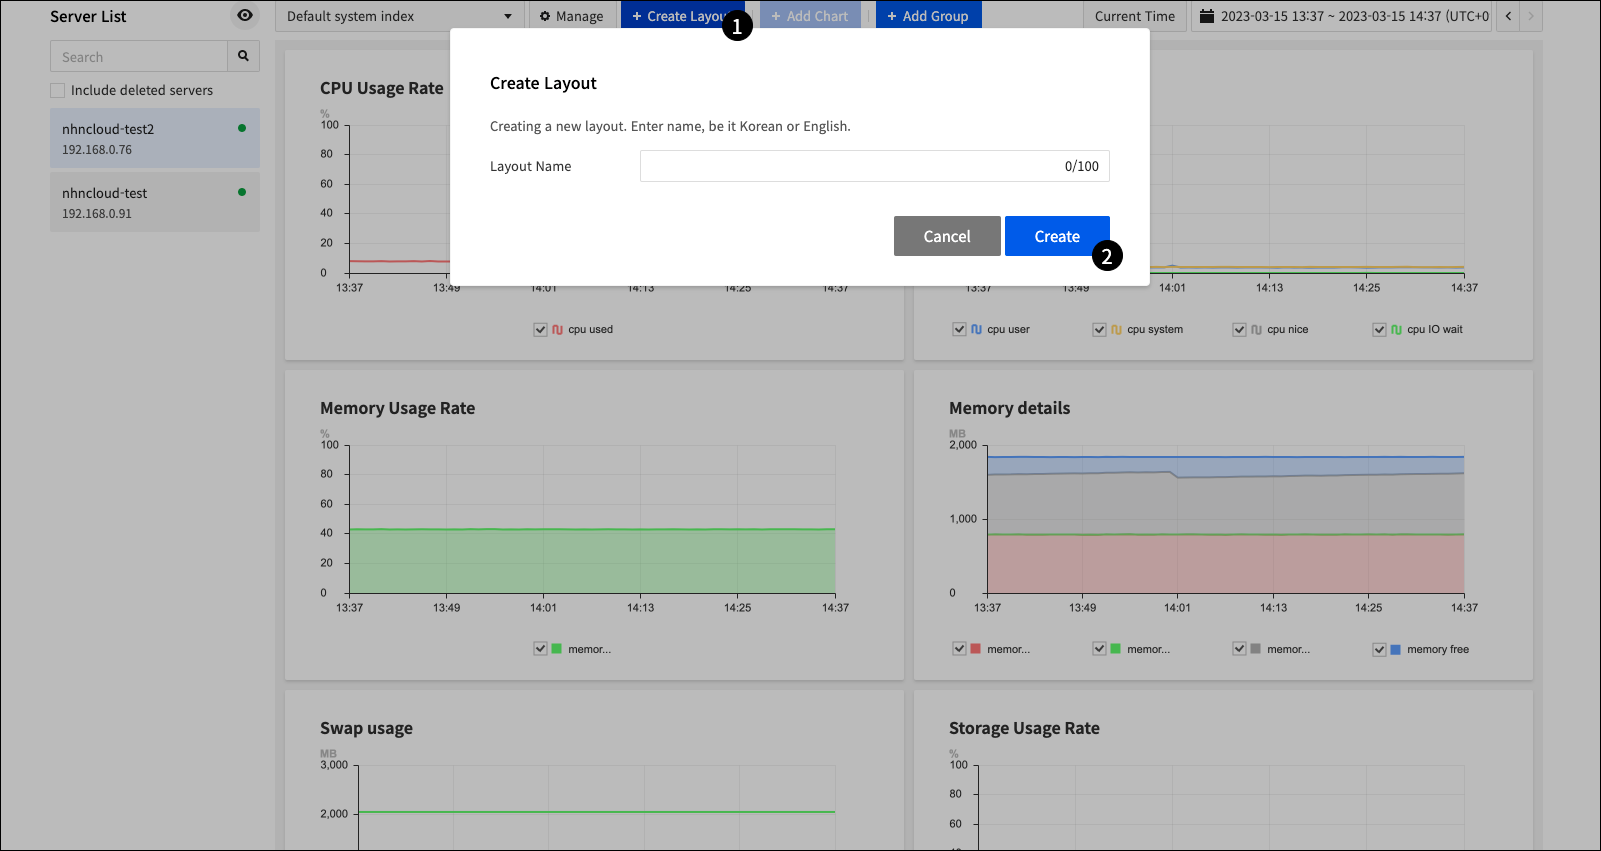
- ❶ When you click Create Layout, a pop-up window appears where you can create a layout.
- ❷ Enter a layout name and click Create to create a layout.
Add Charts to Layout
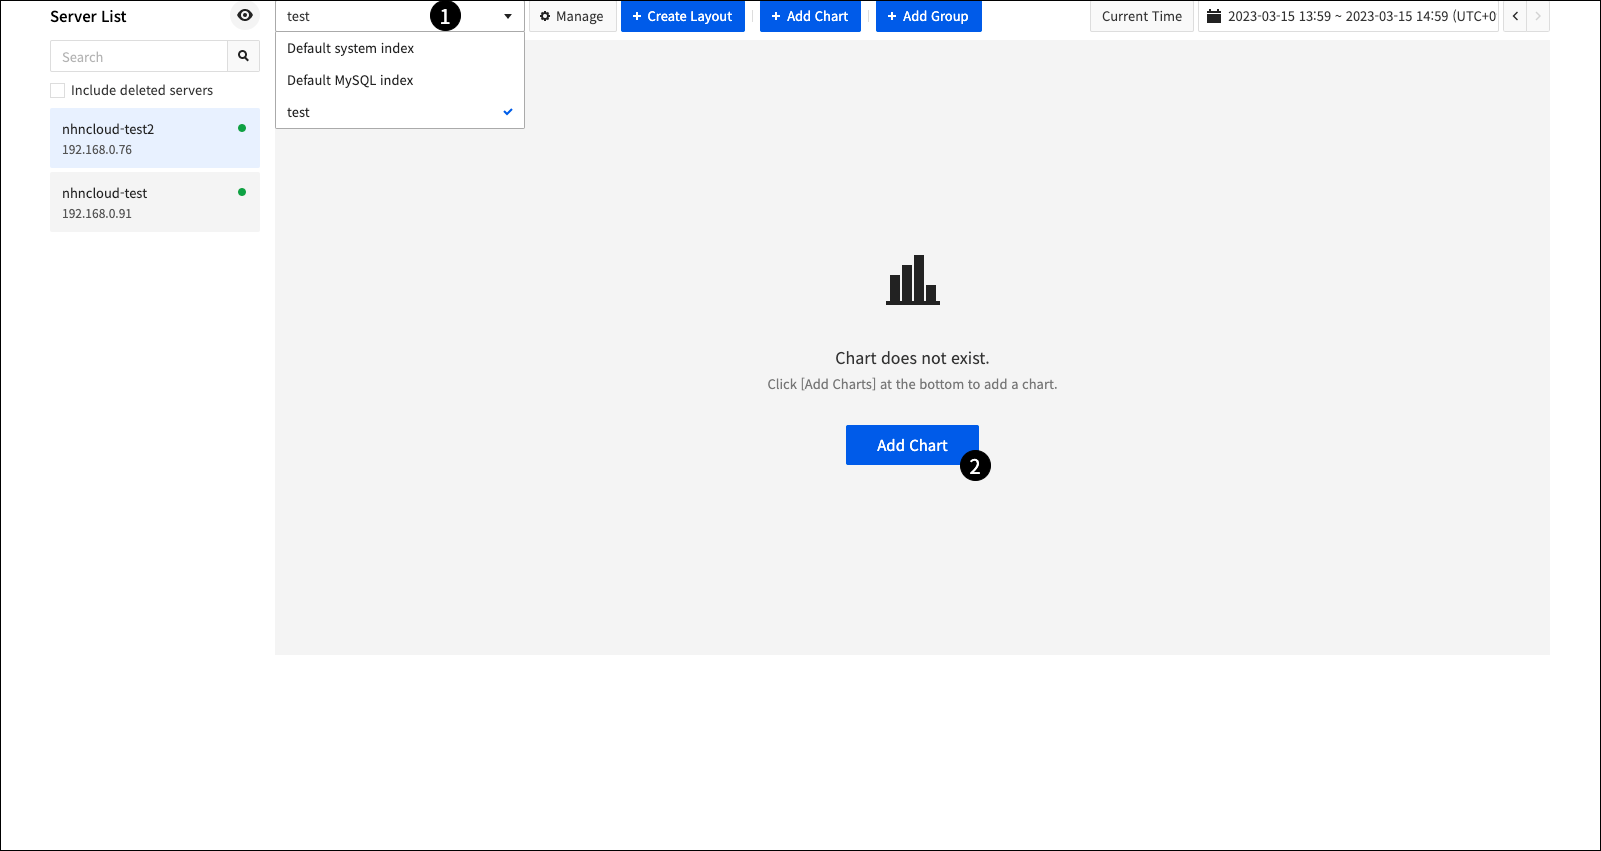
- ❶ Select the layout you want.
- ❷ When you click Add Chart, a pop-up window appears where you can add charts.
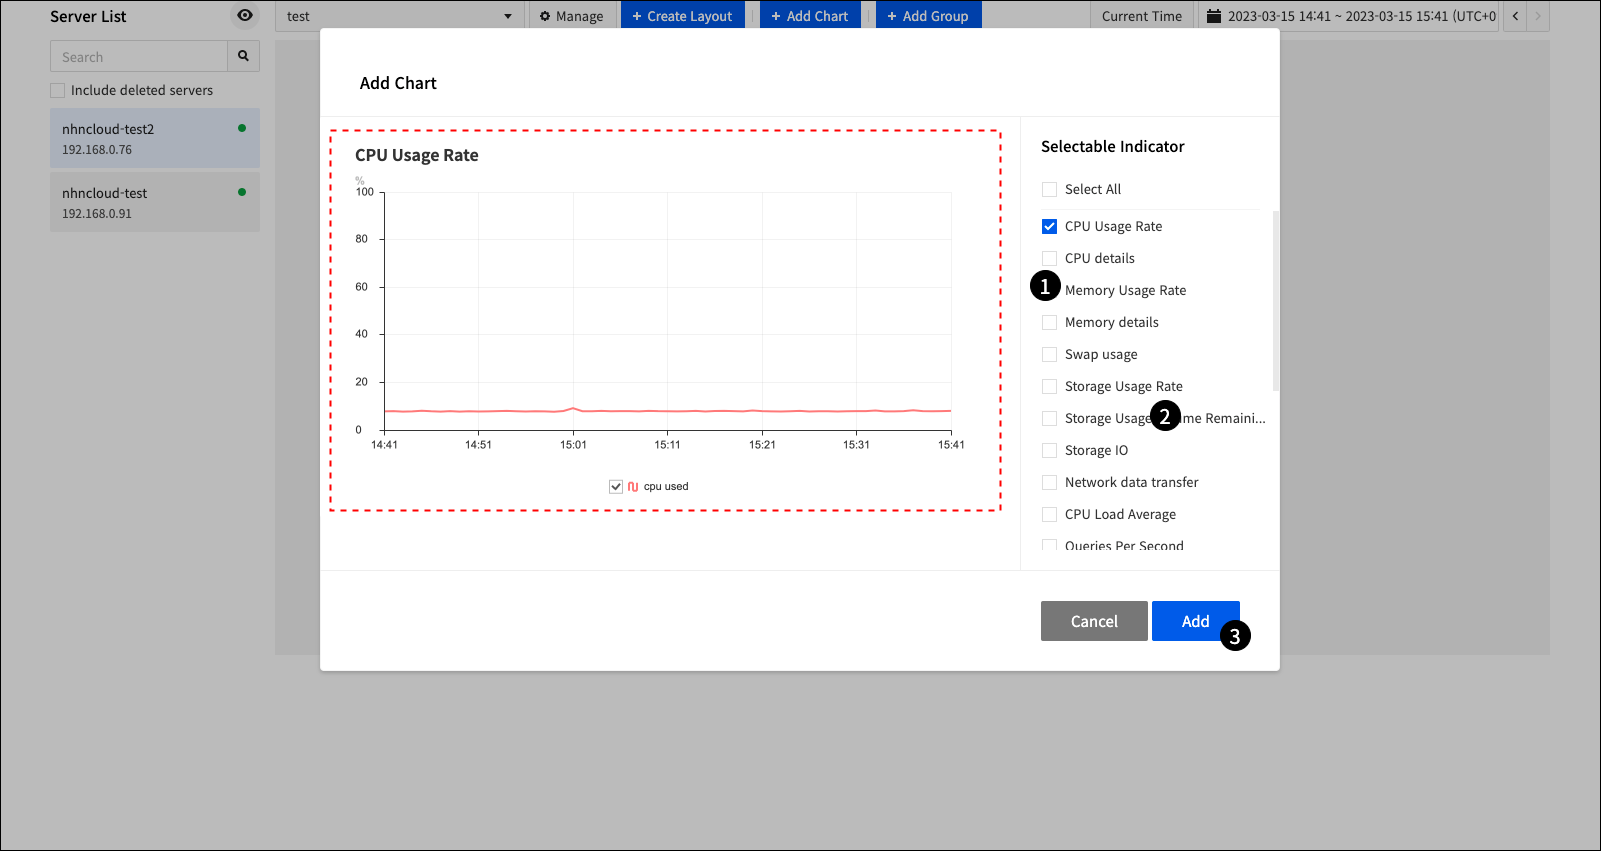
- ❶ You can select multiple charts that you want to add by checking the check box.
- ❷ When you click a chart name, a chart preview appears in the red square area on the left.
- ❸ Click Add to add all selected charts.
Change and Delete Charts in Layout
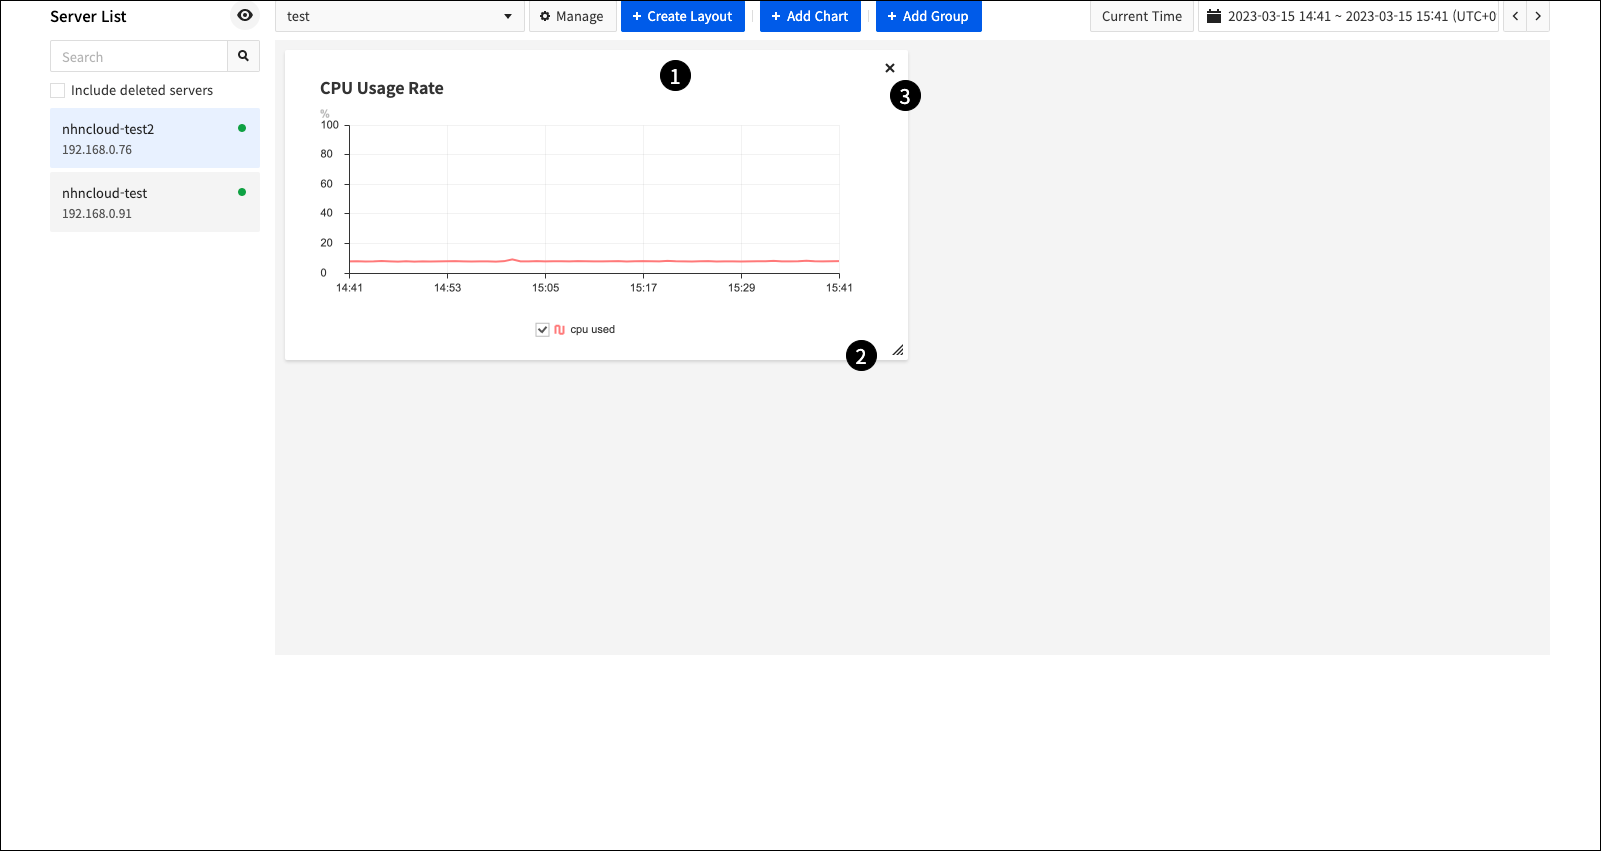
- ❶ You can reposition the chart by clicking and holding the top area of the chart and dragging and dropping it wherever you want.
- ❷ You can resize the chart by dragging and dropping the bottom right area of the chart.
- ❸ When you click x in the upper right corner of the chart, the chart is deleted from the layout.
Chart
You can view various performance metrics for DB instance in chart form. Each performance metric consists of a different type of chart. In addition to default system metrics, MySQL provides various performance metrics in chart form. Metrics that can be found for each chart are as follows.
| Chart | Metrics(Unit) | Description |
|---|---|---|
| CPU Usage Rate | cpu used (%) | |
| CPU Details | cpu user (%) cpu system (%) cpu nice (%) cpu IO wait (%) |
|
| Memory Usage | memory used (%) | |
| Memory Details | memory used (bytes) memory free (bytes) |
|
| Swap Usage | swap used (bytes) swap total (bytes) |
|
| Storage Usage | storage used (%) | |
| Remaining Storage Usage | storage free (%) | |
| Storage IO | disk read (bytes) disk write (bytes) |
|
| Network Data Transfer | nic incoming (bytes) nic outgoing (bytes) |
Default network transfer used by MySQL occurs. |
| CPU Average Load | 1m 5m 15m |
|
| Queries Per Second | qps (count/sec) | |
| Database Activity | select (count/sec) insert (count/sec) update (count/sec) delete (count/sec) replace (count/sec) call (count/sec) |
|
| Buffer Pool | Buffer Pool Total (MB) Buffer Pool Used (MB) |
|
| Slow Query | counts/min | |
| Replication Delay | sec | |
| Row Access | index (counts/sec) full scan (counts/sec) |
|
| Database Connection Status | mysql status | Unable to access: 0, Able to access: 1 |
| Data Storage Defect | disk fault status | Abnormal: 0, Normal: 1 |
Server Group
Server group allows you to view performance metrics for multiple DB instances in a single chart. Performance metrics appear in a single chart for each DB instance that belongs to a server group. Charts that consist of multiple performance metrics are all changed to individual performance metrics across server groups.
Create Server Group
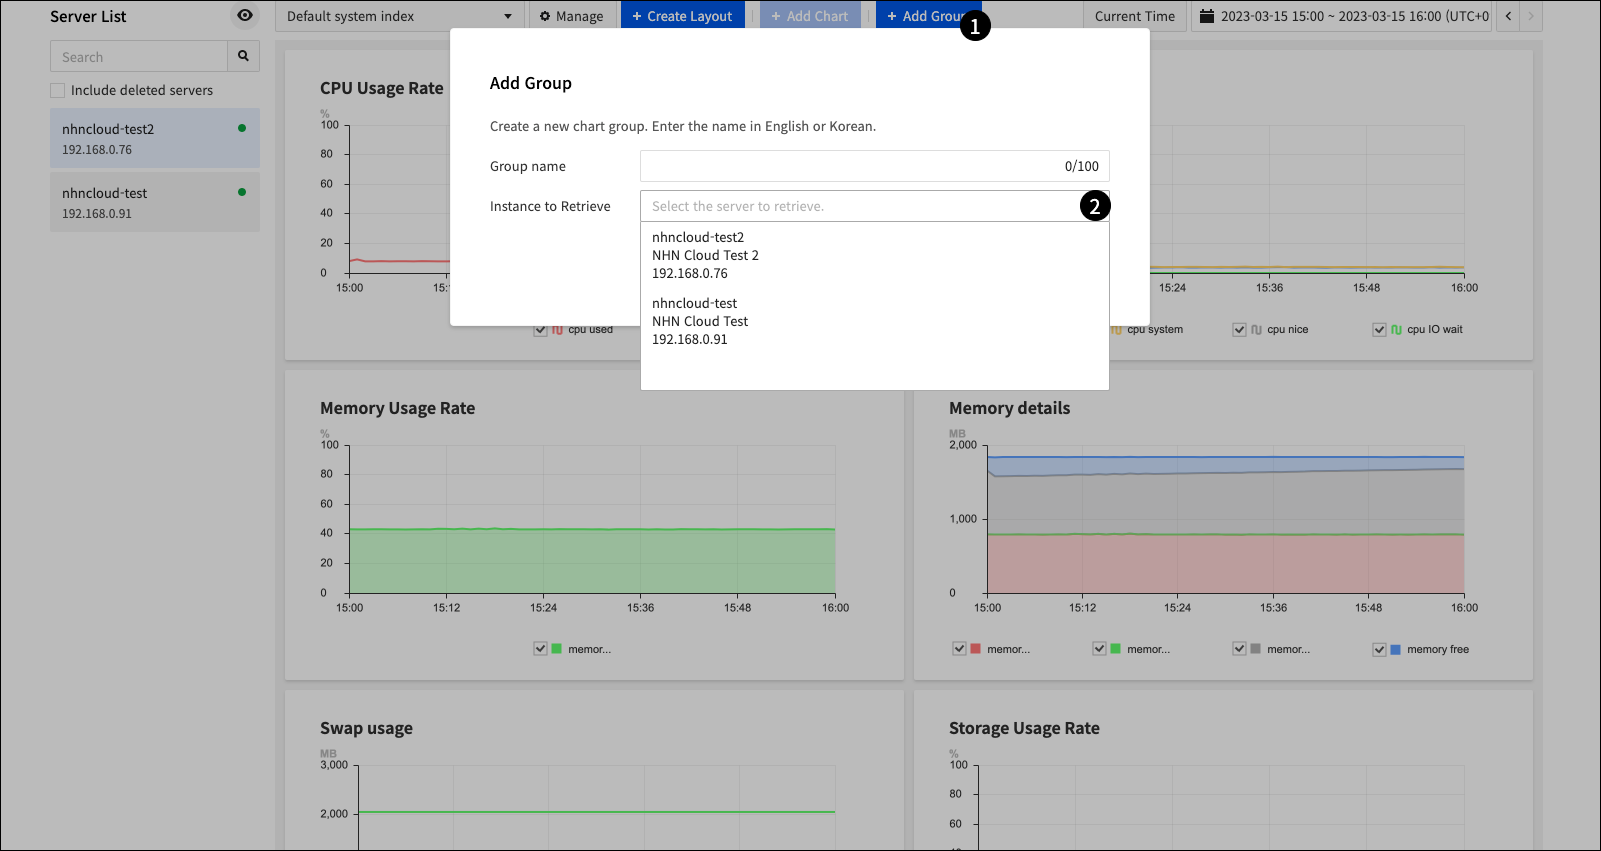
- ❶ Add Group displays a pop-up window where you can create groups.
- ❷ Select DB instance to add to server groups.
Server Group Settings
DB instances and server groups appear together in the list of servers on the left side of the server dashboard.
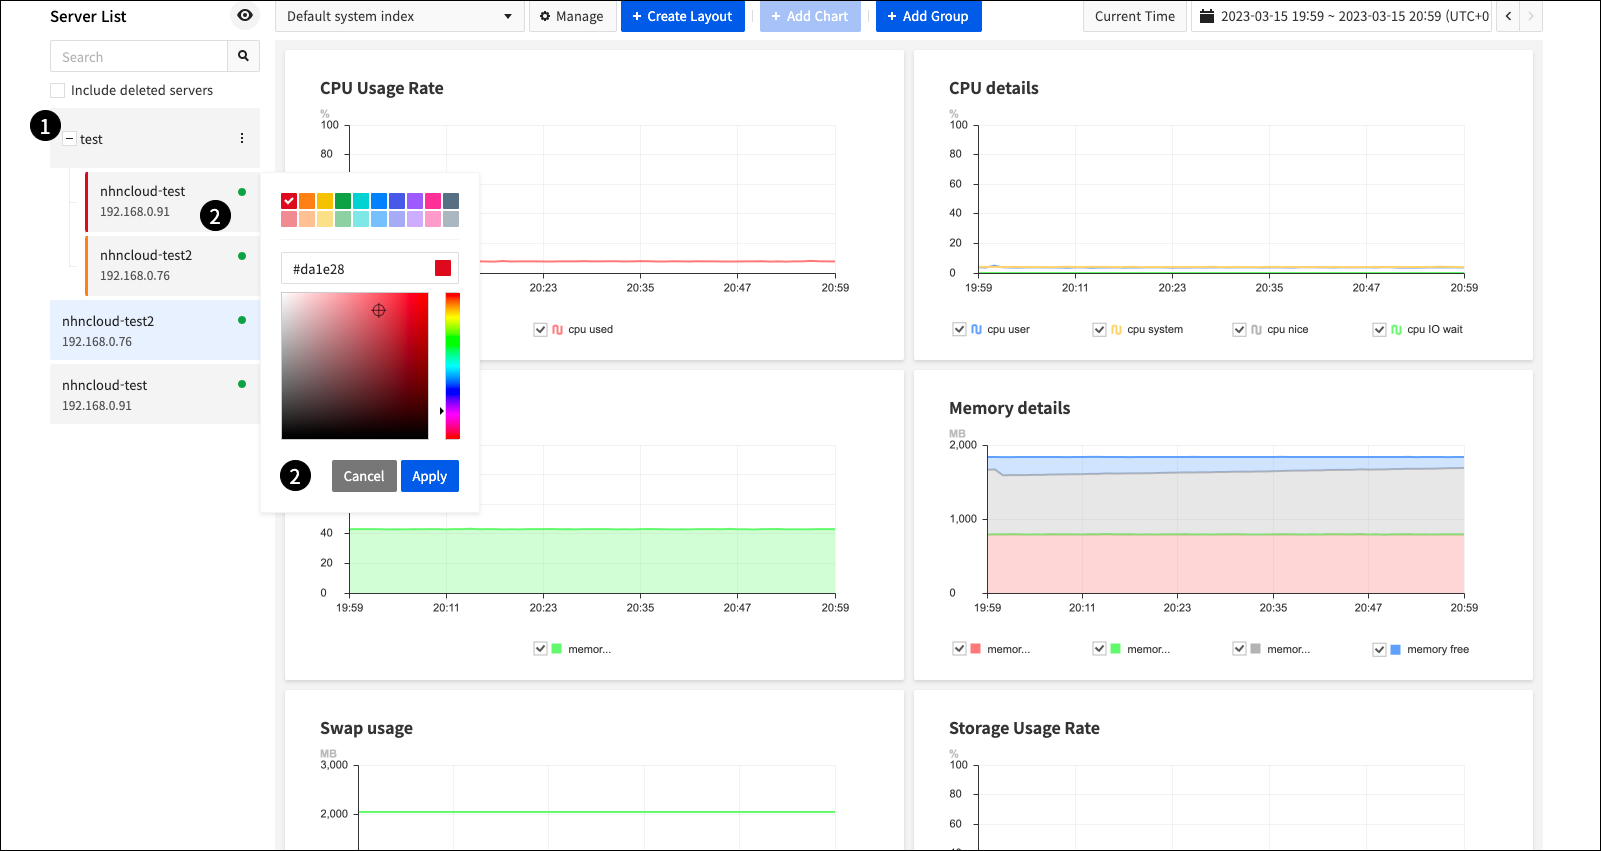
- ❶ Click +, - to unfold or close the server group.
- ❷ When you click DB instance that belongs to a server group, a color selection pop-up appears where you can change the color that will appear in the chart.
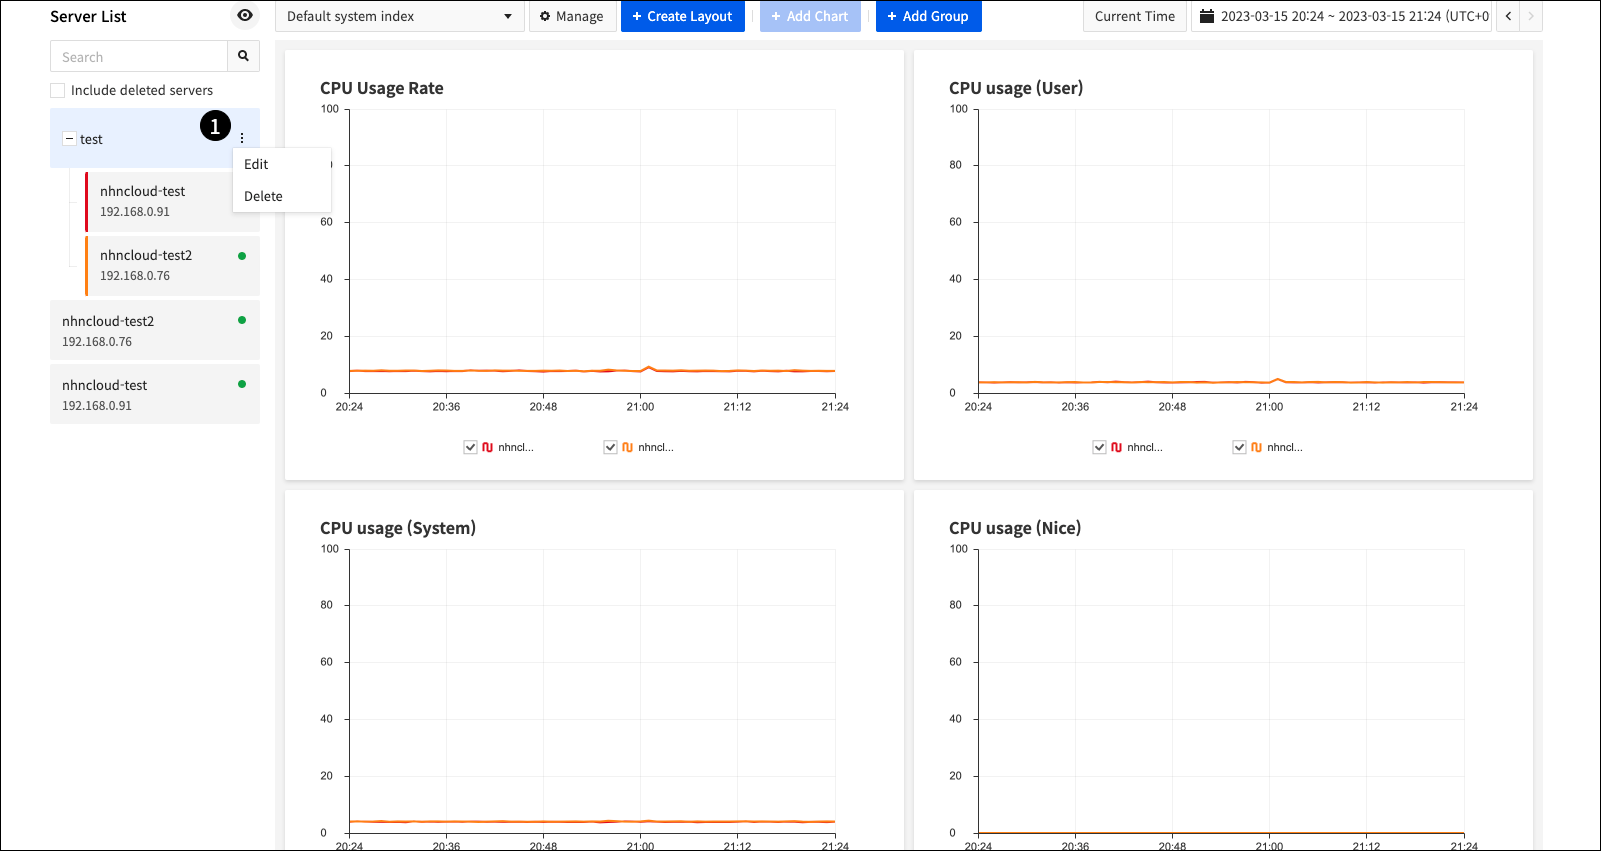
- ❶ :You can change or delete the server group by clicking .